Spectrum/Histogram Browser
This page allows display and simple analysis of histograms currently being accumulated.
The page supports up to 30 concurrent histograms (see Number of Galleries) and the software can manage 8 histogram layouts (see later).
Directory Name
Only used for disc based spectra. This will not appear for memory based spectra - i.e. data acquisition systems.
This is the currently selected disc directory
You may overtype the name with any desired alternative
Up
Only used for disc based spectra. This will not appear for memory based spectra - i.e. data acquisition systems.
Will move to the parent of the currently selected disc directory which now becomes the current directory
Select a directory
Only Used for disc based spectra. This will not appear for memory based spectra - i.e. data acquisition systems.
You can select from the menu any child directory within the currently selected disc directory which now becomes the current
directory
Spectrum Name
This is the currently selected spectrum (either a disc file or memory object).
In the case of disc based spectra it must be a file within the currently selected disc directory.
You may overtype the name with any desired alternative
If the name contains one or more wild card characters (* character) then all matches within the current directory will be
selected and inserted in the Spectrum menu
If the name does not contain wild card characters then it will be taken to be a spectrum and if valid displayed in the
current gallery
Select a spectrum
There are 2 options for selection - Single and Multi. Click on the button to switch between these.
Single - You can select from the menu any spectrum which is shown in the list. This now becomes the current spectrum and
will be displayed in one of the histogram galleries. (See more aout this later)
Multi - You can select a number of spectra from the list shown. Use standard browser choice options; either select
individual histograms from the list or select a start point and stripe up or down.
When finished making your selection click on the "Show" button.
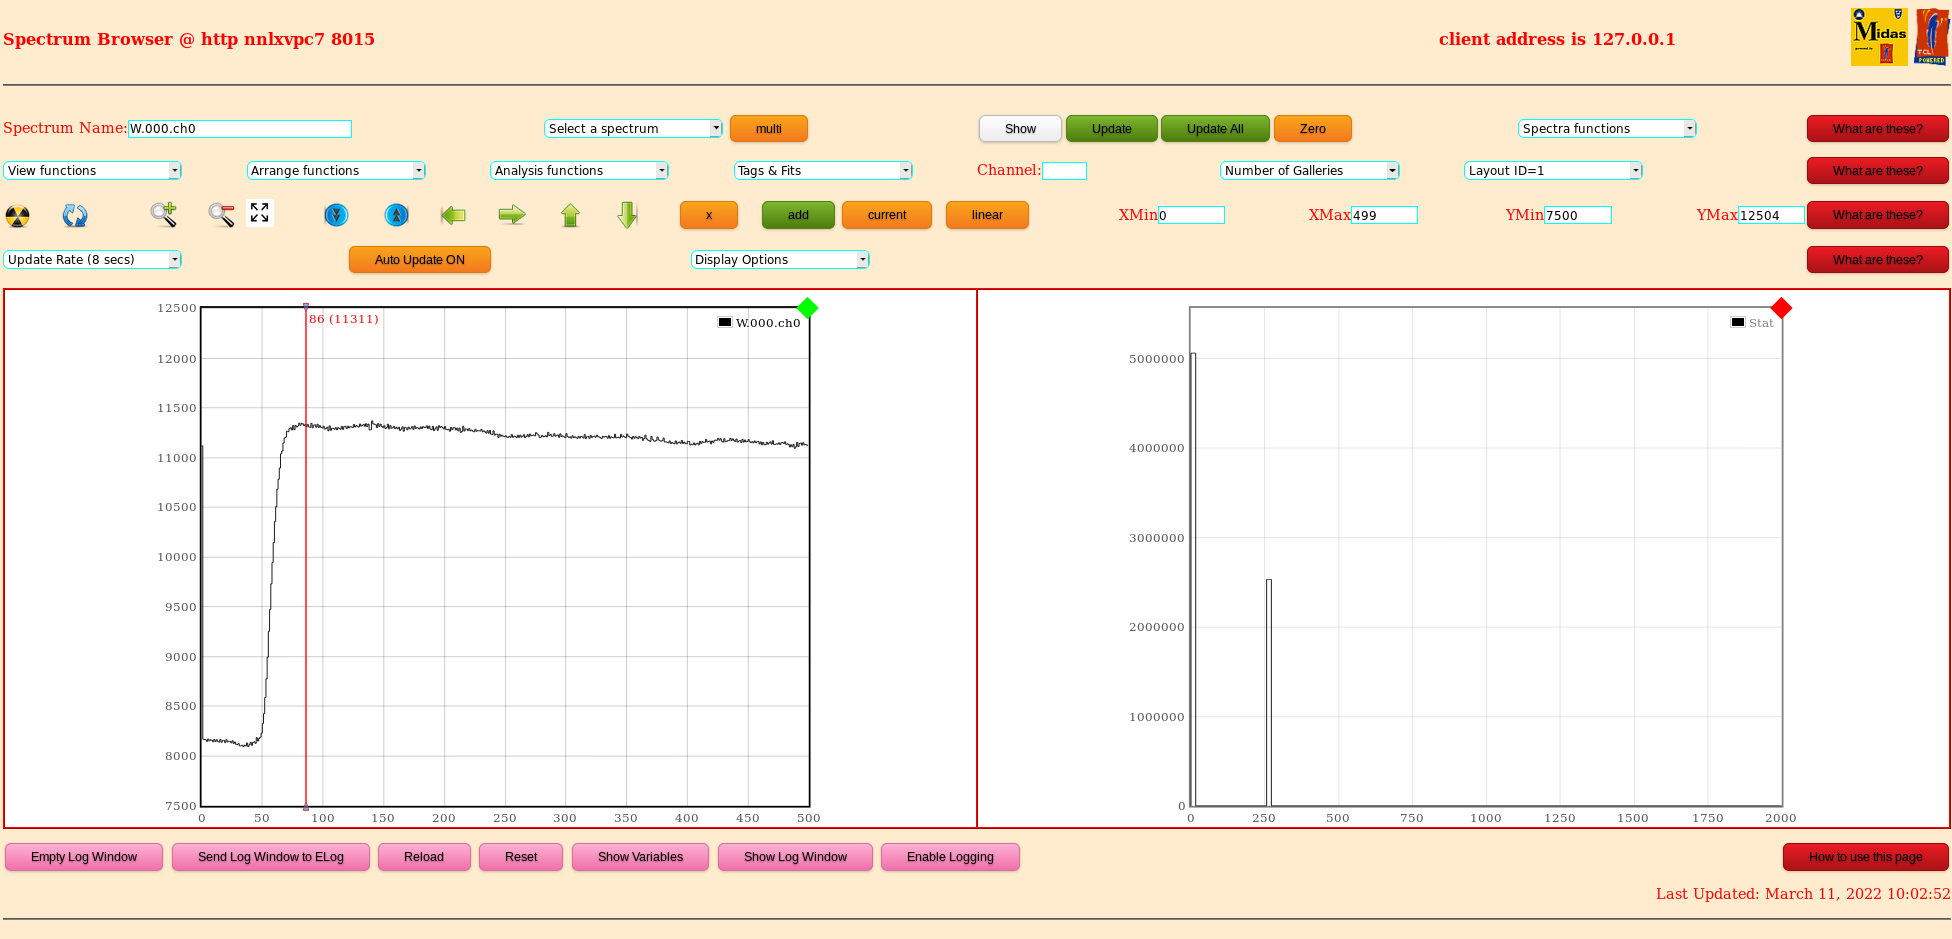
Note - The current selected histogram has a green marker at the right hand end of its display. All other
histograms have a red marker.
Update & Update All
Live memory based spectra are read from the DAQ memory and displayed. They will not be updated unless you click on one
of these buttons or enable the Auto Update feature. This allows the GUI to have consistent data for the histograms
which is used by the analysis functions.
Zero
Zeros the currently selected histograms in DAQ memory. Note that there is a button to Zero all histograms in
the Run Control Window.
Spectrum Functions
A selection of functions applied to the current selected histogram.
"Inquire All" will update the spectrum selection menu with the names of all histograms known to the current histogram source.
"Inquire Matching" will apply a selection using the contents of the "Spectrum Name".
i.e. All Waveform histograms will be selected using W*
View Functions:
A selection of functions which control how the spectra are displayed.
Arrange Functions:
A selection of functions which control how the spectra are arranged for display.
The Remove functions will remove those spectra from the display galleries. They will NOT
in any way alter the histogram source.
The Layout of histograms in the display galleries can be saved into a local disc file.
The restore function will return the Layout to its state when saved. See later.
Analysis Functions:
A selection of simple analysis functions which can be applied to the spectra.
Tags & Fits:
Allow tag markers and fit displays to be removed from the histogram galleries.
Channel:
Applies a tag in the selected (one or all) histogram gallery display at the given channel.
Number of Galleries:
The software currently supports up to 30 histogram galleries (display boxes).
Layout ID
The software currently supports up to 8 histogram layouts. A layout is the current contents
of each histogram gallery.
The Arrange Function menu contains functions to save & restore layouts.
In order for a layout to be restored all histograms mentioned must still exist.
There are a number of icon starting at the right hand side of the screen which are shortcuts to items in the
"View Functions" menu
Reset:
Refresh:
Zoom In;
Zoom Out:
Expand:
Expand Y Scale:
Contract Y Scale:
Move View Left:
Move View Right:
Move View Up:
Move View Down:
Selection Mode using mouse on histogram gallery: Meaningful only when histogram is 2D.
x:
y:
xy:
Histogram creation:
New: Writes histogram overwritting any contents on the current gallery
Add: Writes histogram to an empty gallery
Overlap: Appends histogram to the current gallery
Function Application:
Current: Applies function to the current gallery
All: Applies function to all galleries
Scale mode
Linear: Histograms in the current gallery are shown using a linear scale
Log: Histograms in the current gallery are shown using a log scale
Axes X asis XMin => XMax
Y asis YMin => YMax
Update Rate:
Defines the histogram update rate (updates/sec) when "Auto Update" is enabled
Auto Update:
Enables and Disables the histogram Auto Update feature.
Click on "Auto Update ON" switches the option from OFF to ON
Display Options:
Controls for various histogram display options
1d Line Colours:
select the colour to change in the palette; click on "Select Colour" and select new colour from the chooser
2d Colours
As above or select a palette from the menu
2d Contours
Select the contour colour and define levels either by entering value or selecting range definition
These start a sub window. Select "finished" to remove.
V Pucknell; STFC; Daresbury Lab updated 10 MArch 2022